Comparing Noninvasive & Invasive Hemodynamics in Cardiogenic Shock
- Neev Patel
- May 15, 2024
- 6 min read
Updated: Jul 23, 2024
Introduction
Assessing hemodynamics is crucial for managing patients with severe cardiac conditions in critical care. Both noninvasive and invasive methods have their roles, and understanding their comparative utility is essential for optimal patient care. This blog explores a case study comparing noninvasive hemodynamic assessment using Critical Care Echo and invasive hemodynamic measurements, incorporating the mechanisms behind VEXUS findings.
Case Presentation
A 62-year-old male with heart failure with reduced ejection fraction (HFrEF) of 20% was admitted for cardiogenic shock. The patient, on 4L nasal cannula (NC), presented with a productive cough and tested positive for respiratory syncytial virus (RSV) infection.
Clinical Findings:
- Jugular Venous Distension (JVD): Positive
- Crackles: Present
- Pedal Edema: Absent
- B lines on Lung US: Present bilaterally
The patient had been on diuresis for two weeks with intermittent response and resistance, leading to frequent adjustments in diuretic therapy. Despite these efforts, the patient remained on a dobutamine drip at or above 5 mcg/kg/min.
Before moving on to doppler, below is basic information on the common Doppler modes used for Echo:
1. Pulsed-Wave Doppler:
Measures the velocity of blood flow at a specific location by sending short bursts of ultrasound waves and receiving echoes.
Useful for assessing blood flow through heart valves or vessels in a specific area.
2. Continuous-Wave Doppler:
Measures the velocity of blood flow along the entire ultrasound beam
Ideal for evaluating high-velocity flows, as those seen in valvular regurgitation.
3. Color Doppler:
Provides a visual representation of blood flow within the heart and vessels using color coding to indicate flow direction and velocity.
Red indicates flow towards the transducer, while blue indicates flow away from it.
4. Tissue Doppler Imaging (TDI):
Measures the velocity of myocardial tissue motion, rather than blood flow, by detecting the Doppler shift of ultrasound waves reflected from the heart muscle.
Used to assess diastolic function (to see how fast and how much the ventricles are relaxing in diastole).
Advantage: Can detect subtle changes in heart muscle movement that might not be apparent with traditional Doppler techniques.
For the purose of VEXUS- pulse doppler is used for all three- hepatic, portal, and intrarenal doppler.
Noninvasive Hemodynamics Using VEXUS and Critical Care Echo:
The bedside ultrasound, performed on the same day as the right heart catheterization (RHC), provided valuable noninvasive hemodynamic insights using the VEXUS scoring system.
VEXUS Assessment and Grading (Patient in Atrial Fibrillation):
Hepatic Vein (HV):
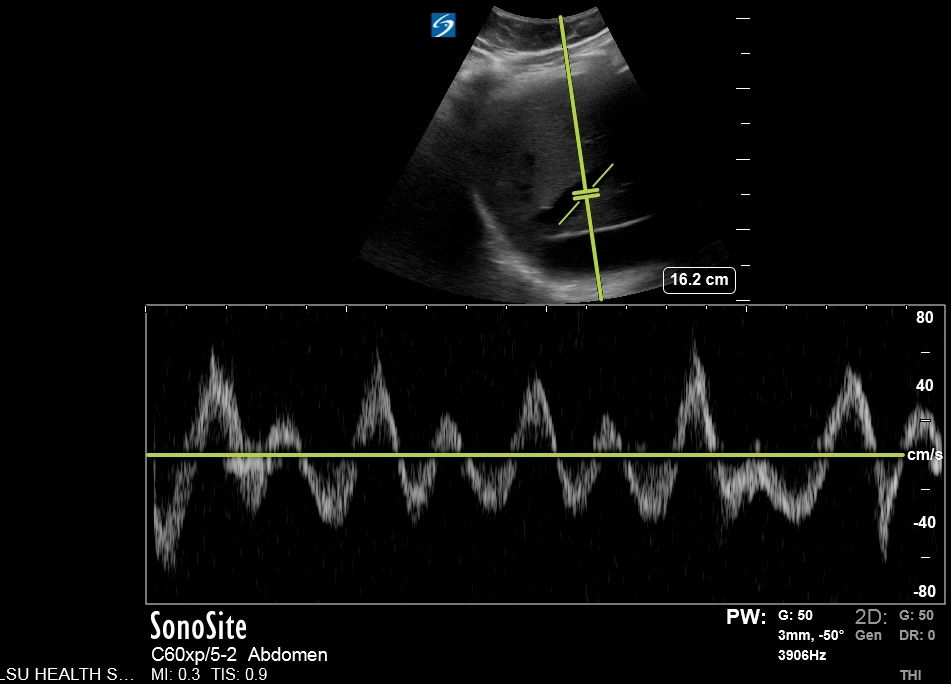

S wave reversal indicating severely abnormal.
Normal Mechanism: During right ventricular (RV) contraction, the tricuspid annulus moves downward, reducing pressure in the right atrium (RA) and allowing blood to flow from the hepatic vein to the RA.
S Wave Reversal: In severe congestion, the RV is so filled with volume that the tricuspid annulus cannot move downward effectively. This causes impaired forward flow and atrial contraction-induced backward movement, leading to S wave reversal.
Portal Vein (PV): Approximately 50% pulsatility.
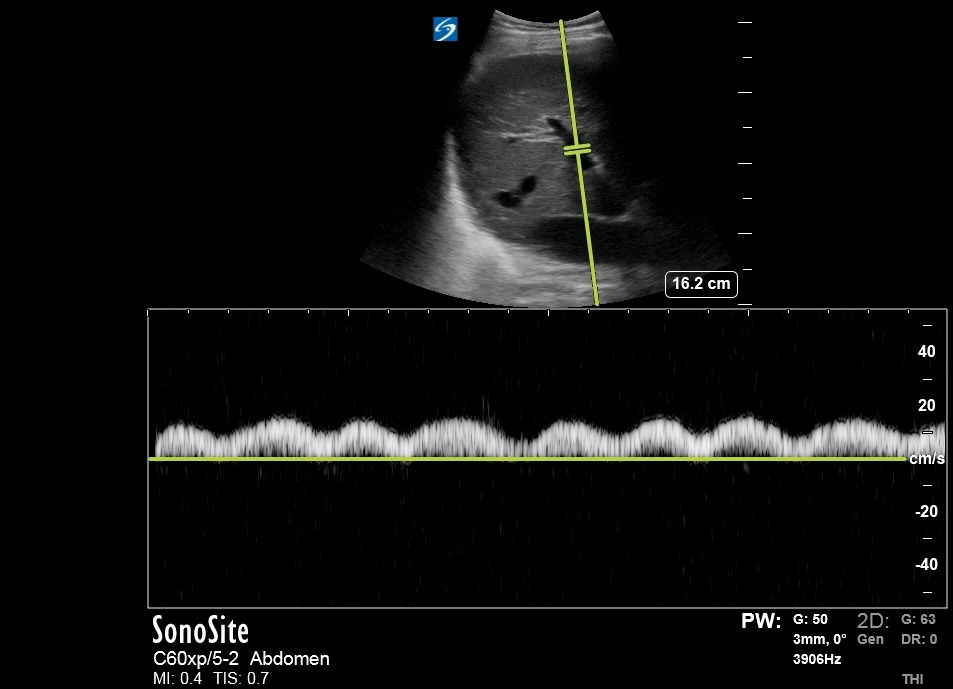
Normal Mechanism: The hepatic sinusoids, located between the portal vein and hepatic vein, expand and contract to absorb pressure fluctuations, resulting in less than 30% pulsatile flow.
Severe Congestion: Increased retrograde flow from the hepatic veins raises resistance within the hepatic sinusoids, creating more than 50% pulsatility and, in advanced cases, a biphasic pattern.
Intrarenal Venous Doppler (IRVD): Discontinuous monophasic waveform.
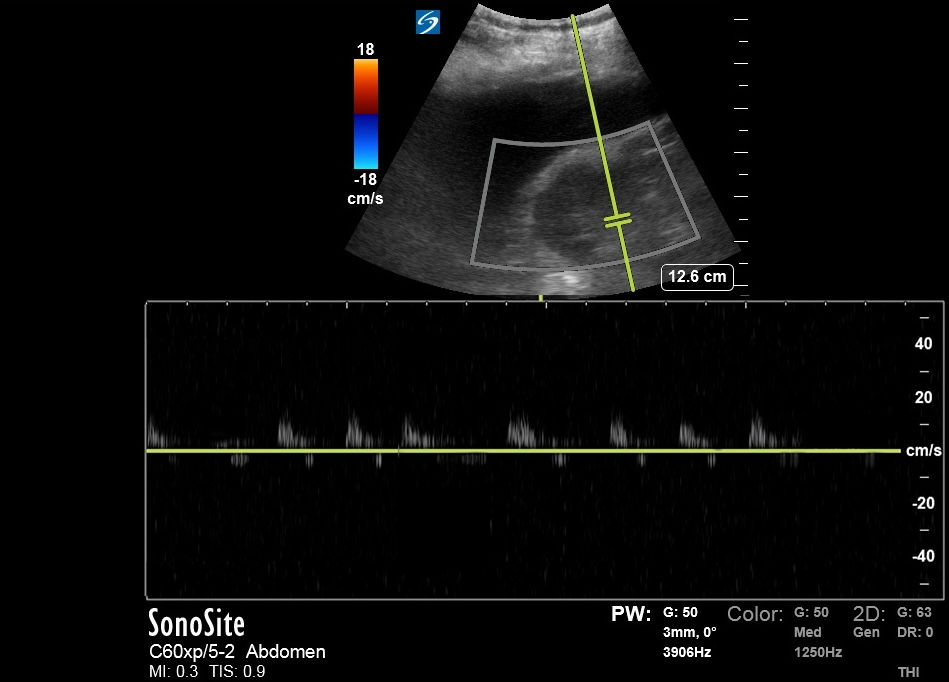
Normal Mechanism: Renal veins exhibit continuous monophasic flow during both systole and diastole.
Discontinuous Monophasic Flow: In severe volume overload and increased central venous pressure (CVP), flow only occurs during diastole when the heart relaxes, allowing central veins to empty.
The monophasic intrarenal Doppler waveform also explains the patient's resistance to diuretics. As per literature, monophasic IRVD has shown to be associaed with poor diuretic repsone and diuretic resistance. (https://www.sciencedirect.com/science/article/pii/S2213177916301214?via%3Dihub)
Here, VEXUS Grade would be 3 (indicating severe venous congestion)
For reference:

2. Hemodynamic Parameters from Critical Care Echo
Understanding Hemodynamic Parameters:
1. Left Ventricular Outflow Tract Velocity Time Integral (LVOT VTI):
Using: Pulse (power) doppler since its a forwards flow and our aim is to capture the velocity in the direction of LVOT opening. This is done in apical 5 chamber.
You can easily navigate to 5 chamber view from Apical-4-chamber view by fanning the probe head slighty superior- so that it would then focus on LVOT which will appear in in between all 4 chamber- hence the term 5 chamber view. Here is an example:
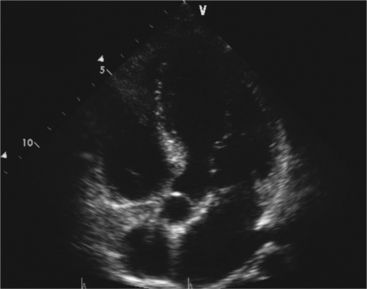
Next step is to put the sample gate of doppler right before the opening of aortic valve. The direction on gate, would need correction to align with the direction of LVOT flow, as shown below:

(small double lines is the gate; single in the direction of LVOT is the sampling direction)
Normal Mechanism: LVOT VTI measures the distance blood travels through the left ventricular outflow tract during one cardiac cycle, reflecting the stroke volume.
Low LVOT VTI: A lower value indicates reduced stroke volume, often seen in heart failure, where the heart's pumping ability is compromised.
To calculate cardiac output from LVOT VTI, you measure the LVOT VTI using Doppler ultrasound and then multiply it by the cross-sectional area of the LVOT and the heart rate. The formula is:
(Cardiac Output) = {LVOT VTI} x {LVOT area} x {Heart Rate}
This calculation gives you the volume of blood ejected by the left ventricle per minute. Most ultrasound machines will have it incoroporated for CO caluclation, all you need to do is calculate LVOT D (from PLAX) and VTI (from apical 5 chamber view).
Note that LVOT D is the only parameter to be obtained from PLAX view, rest all can be obtained from apical 5 chamber.
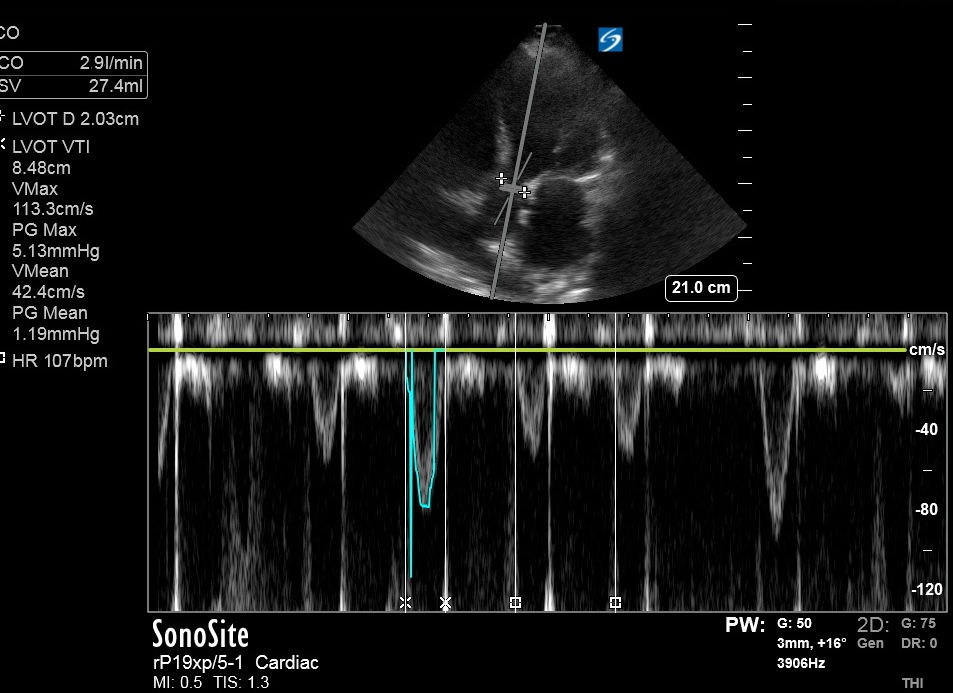
Cardiac Output (CO) using LVOT VTI: 2.9 L/min
(average waveform selected due to atrial fibrillation, as there will be variation in stroke volume with each beat).
Note that the machine did the calculation itself in upper left corner of the image. HR is set by R-R interval, by adjusting 2 vertical lines on contiguous ventricular contractions/R waves- which you can manually select.
2. Mitral Regurgitation Peak Velocity (MRVmax):
MRVmax is the peak velocity of blood flow across the mitral valve during systole. It helps estimate the severity of mitral regurgitation.
Using: Continous (spectral) doppler since its a high velocity regurgitant flow.
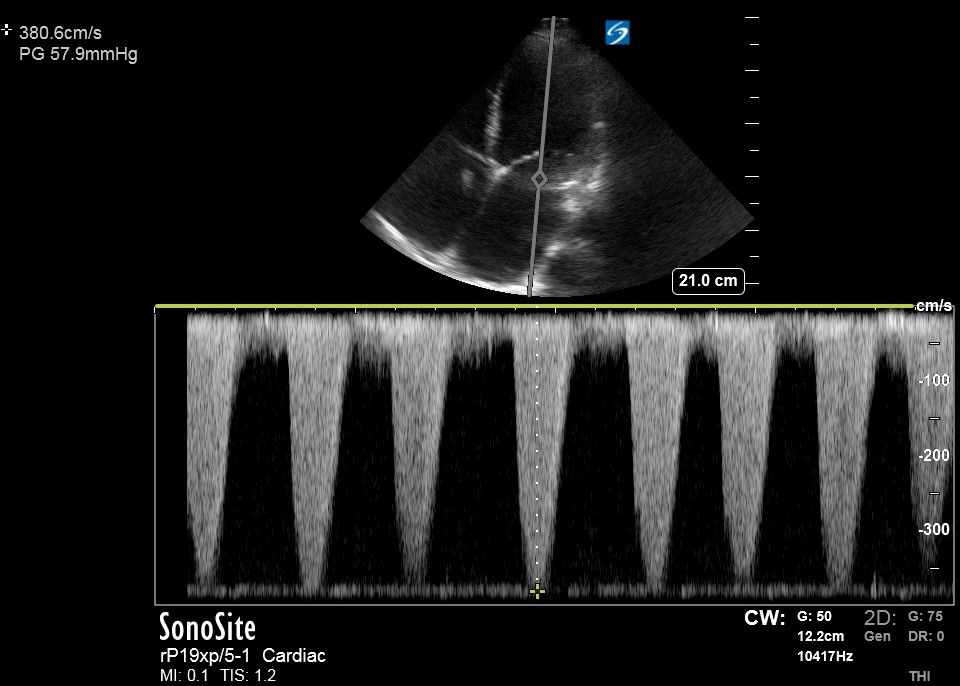
High MRVmax:
Higher values can indicate significant mitral regurgitation, which increases left atrial pressure and can impact overall cardiac output.
MRVmax here was mainly done here for afterload assssment as shown below:
3. Systemic Vascular Resistance (SVR):
This is based on the study:
Abbas AE, Fortuin FD, Patel B, Moreno CA, Schiller NB, Lester SJ.
Noninvasive measurement of systemic vascular resistance using Doppler echocardiography. J Am Soc Echocardiogr. 2004 Aug;17(8):834-8. https://linkinghub.elsevier.com/retrieve/pii/S0894731704003785
The study showed that MRVmax/LVOT VTI correlated well with SVR (r = 0.842, 95% CI 0.7-0.92, P < .001, Y = 0.459 + 49.397*X).
In simple words, it is basically a ratio of Backward flow/forwards flow. And if SVR is high backward flow will increase and forwards would decrease.
MRVmax/LVOT VTI ratio > 0.27 had a 70% sensitivity and a 77% specificity to identify SVR > 14 WU (1120 dynes)
MRVmax/LVOT VTI ratio < 0.2 had a 92% sensitivity and a 88% specificity to identify SVR < 10 WU (800 dynes)
In our case, MRVmax/LVOT VTI ratio - 0.45 (> 0.27 sugegstting SVR > 1120 dynes)
Also, note that this method is not validated in patient with structural valvular disease or primary MR. This is only in the context of secondary/functional MR which often happens in dilated cardiomyopathy and volume overload.
Overall Interpretation for noninvasive findings:
- Preload: VEXUS grade 3 indicates severe congestion.
- Cardiac Output: 2.9 L/min suggests a reduced cardiac output.
- Afterload: SVR > 1120 dynes/cm² reflects increased systemic vascular resistance.
Invasive Hemodynamics Using Right Heart Catheterization (Gold Standard)
Patient was taken to cath lab for RHC given suboptimal diuretic response in shock with worsening renal function; to assess for filling pressures and shock etiology:

RHC findings:
RA: 24 RV: 55/ 10/ 15 PA: 62/ 39/ 50 PWP: 35 .
Cardiac output was 2.6 by Fick. Cardiac index is 1.3 L/min/m2.
02 Sat: RA 41% PA 44%.
SVR 1723
Summary:

Discussion:
The comparison between noninvasive VEXUS scoring and invasive RHC hemodynamics highlights the strengths and limitations of each approach. Noninvasive methods like Critical Care Echo with VEXUS scoring offer quick, bedside assessment and can guide immediate management decisions. However, invasive methods such as RHC provide precise measurements, crucial for complex cases requiring detailed hemodynamic profiles.
Conclusion
In this case, the noninvasive VEXUS score effectively identified severe venous congestion and its contribution to diuretic resistance, aligning well with the invasive RHC findings. This case underscores the value of integrating both noninvasive hemodynamic assessments routinely in the management of critically ill patients in shock.
Author: Neev Patel, MD

Comments